Reverting to the Mean
You have probably heard the phrase “Reverting to the Mean” before, but what does it really mean in the investment world? According to Investopedia, ‘Mean Reversion’ theory suggests that prices and returns eventually move back towards their mean or average. This mean or average can be the historical average of the price or return or another relevant average such as the growth in the economy or the average return of an industry.
More specifically, as it relates to investing, this phrase generally means that any legitimate equity investment whether stocks or real estate cannot grow at a rate above its long term average indefinitely. Conversely, the same investment cannot grow at a rate below its long-term average rate indefinitely. The investment, eventually, will return back to its average or mean growth rate.
Some people use this theory as a trading strategy in the markets. I do not recommend anyone do this. However, understanding and paying attention to the ‘Mean Reversion’ concept as a macro market indicator can help you decide for yourself (and ignore CNBC analysts) whether it is a good time to be heavily invested in stocks. I think this concept has some implications for today’s stock market. Let me explain what I mean.
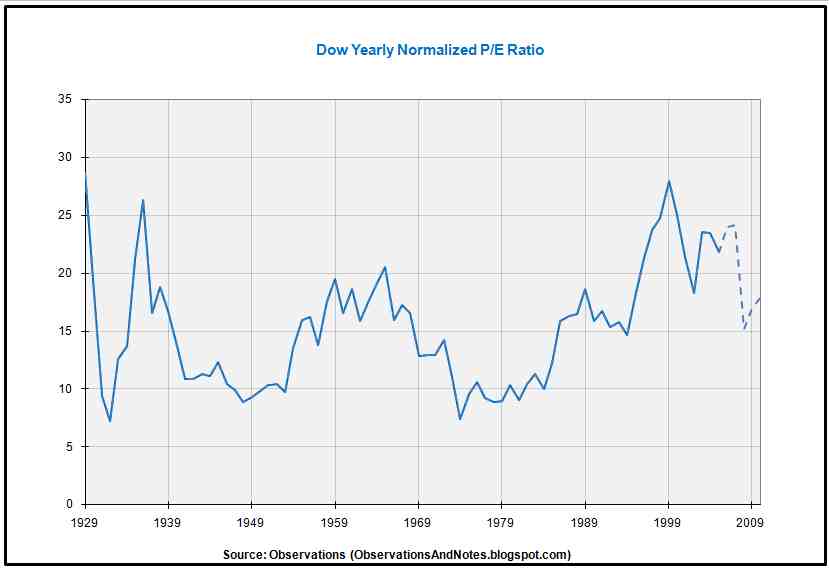
Looking at the history of the Dow Jones Stock Index Price/Earnings (P/E) ratio in the chart below, no matter how far the market average P/E ratio wanders away from the average or mean P/E ratio, the index P/E ratio eventually moves back towards the historical mean of about 15.
Let’s look specifically at the periods from about 1935 to 1939 and 1957 to 1968 on the chart. These years represent periods where the normalized P/E ratio is over the historical average of 15. In the years following these two periods of above average P/E ratios, the P/E ratio spends many years below the average of 15. This is to be expected; for the average P/E ratio to be around 15, the market P/E ratio needs to spend as much time below 15 as it does above 15.
(Click Image to Enlarge)
Now look at the period from about 1995 until the end of the chart. With the exception of a brief moment at the end of 2008, the average normalized P/E ratio has been above 15 the entire period. The current normalized P/E ratio (summer 2012) is around 20. This means that the Dow Jones P/E ratio has spent the better part of two decades (1995 to 2012) above its long-term average of 15.
For the long-term average P/E ratio to “revert back to its mean” of 15, the Dow index must spend some time with its P/E ratio below 15. Despite the current low interest rate environment, I believe there is a high probability this will happen in the near-term. The reason I believe this is not only because of the data in the P/E chart. The current stock market is facing some head winds.
During the depth of the 2008-2009 financial crisis, out of fear for survival, US companies reduced their operating costs like never before. With the improvement in the economy in 2010 and 2011, all these costs savings US companies had made went straight to their bottom line. Corporate earnings reached record levels. However, unless top-line revenue continues to increase, I do not see how these companies can continue to increase their earnings.
I cannot see any near-term top-line earnings growth because of the amount of government and personal debt that now exists in the US and all the western economies. Additionally, wage income growth in the US and Europe is minimal. The Dow Jones Index companies do obtain a certain amount of their revenue from developing nations. However, the developing nation economies are themselves slowing down. This is because the developing nations are largely export economies that sell goods to western countries. Because of the debt load, the western countries cannot continue purchasing these goods at the same rate.
This is how I would evaluate the current stock market. If the companies that make up the Dow Jones stock index are experiencing record level corporate earnings and top-line revenue is not likely to increase significantly, then the only way that the Dow Jones index can go higher is if the average P/E ratio increases above its current value of about 20. I just don’t believe this is going to happen. Additionally, what if the current record corporate earnings decrease? Just to keep the already high P/E ratio at its current level of 20, the market must fall.
For the record I am not predicting a stock market crash. If I had to guess, I think large capitalization stocks will probably move sideways for the next few years. However, I would not rule out a market meltdown similar or greater to the 2008-2009 market crash. I would advise most people to re-assess their equity allocation percentage.
In our case, not including cash we have set aside for a future home purchase, we have about 48% of our financial assets in stocks which include our precious metals holdings. However, given the analysis above, I am contemplating lowering our equity allocation. But keep in mind, we are retired so we cannot afford to make any big investment mistakes.
Did you enjoy this post? Why not leave a comment below and continue the conversation, or subscribe to my feed and get articles like this delivered automatically to your feed reader.


Comments
No comments yet.
Sorry, the comment form is closed at this time.